How to Interpret a Gamma Ray Log: A Practical Guide for Formation Evaluation

Written By: Computer Science Professor
Deeply rooted in the R&D of simulators for the oil and gas industry, committed to bringing safety to every oil worker.
In the process of stratigraphic evaluation, gamma-ray (GR) logging is a commonly used method for quickly identifying rock types and determining changes in shale content. However, when interpreting the logging curves, it should not be simply assumed that “high GR values indicate shale and low GR values indicate sandstone”.
More importantly, what geological features do the GR curves reflect? Before classifying them as reservoirs, what key information needs to be verified?
Here is a set of practical analysis procedures.
Start with the GR Curve: What Are You Actually Looking For?
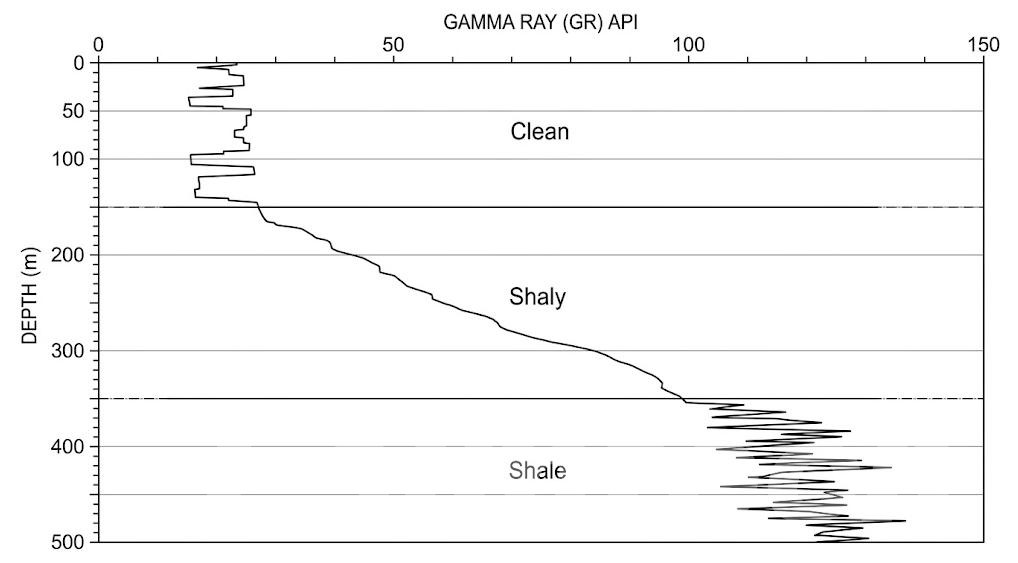
The first step is to interpret the natural gamma (GR) curve based on the surrounding strata, rather than simply applying the universal API threshold.
Natural gamma radiation mainly comes from radioactive elements such as potassium, thorium, and uranium. Strata rich in clay typically contain more of these elements, so shale often shows a higher GR value, while pure sandstone and most carbonate rocks typically show a lower GR value.
When interpreting the well logs, focus on the following three aspects:
- GR value level. Continuously low GR values usually indicate a purer formation, while higher GR values typically indicate an increase in shale or clay content.
- Curve changes. Rapid and continuous changes in the GR value are helpful for identifying formation boundaries, but short spikes should not be directly regarded as changes in lithology.
- Curve shape. A relatively box-shaped low GR response may indicate a purer sandstone; a gradually increasing GR value usually indicates an increase in shale content, and a jagged curve may reflect thin interbeds of sandstone and shale.
Before calculation, determine the range of GR variation in the region and select representative “pure sandstone GR values” (GRclean, from the purest layer section) and “shale GR values” (GRshale, from the layer section with obvious shale content). These reference values based on the local formation are usually more valuable than fixed thresholds like “30 API representing pure sandstone”.
Calculate Shale Volume—But Know the Limits
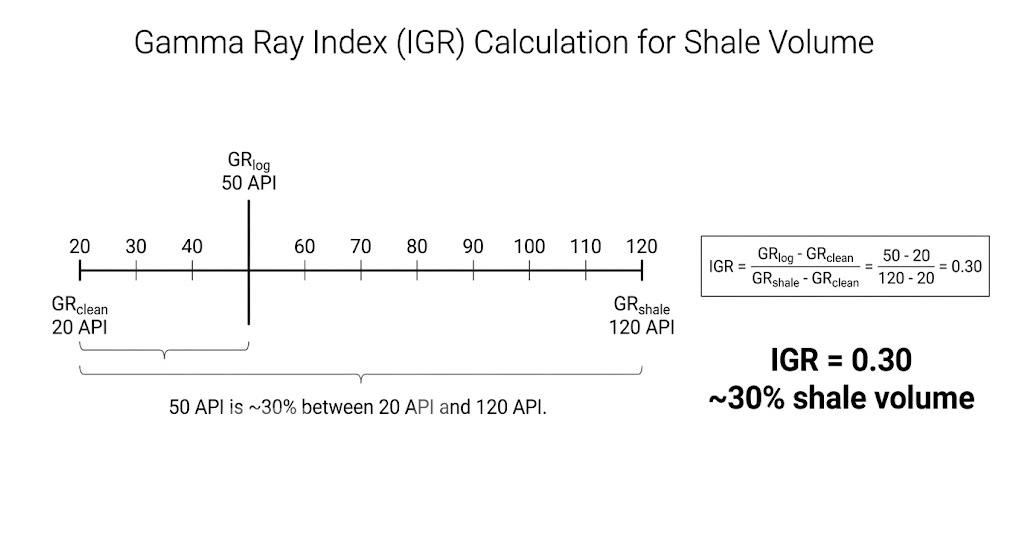
After determining the local GR range, the GR index (IGR) can be used to quantify the position of a certain stratum between the two end members, “pure rock layer” (clean) and “shale layer” (shale):
IGR = (GRlog − GRclean) / (GRshale − GRclean)
For example:
- GRclean = 20 API
- GRshale = 120 API
- GRlog = 50 API
Then:
IGR = (50 − 20) / (120 − 20) = 0.30
According to the simple linear model, the estimated shale content is approximately 30%.
This method is suitable for rapid preliminary analysis in formation evaluation, but it is not applicable to all formations. Some formations require the use of nonlinear shale content models, and the calculation results will also be affected by the selection of pure rock layers and shale baselines.
In addition, shale content (Vsh) is not the final indicator for evaluating reservoir quality. It is necessary to determine whether the estimated shale content will affect effective porosity, permeability, net thickness of the reservoir, and subsequent saturation calculations.
Therefore, the Vsh calculated based on GR should be used as an auxiliary indicator for reservoir interpretation, and it cannot replace the complete well logging interpretation.
Combine GR with Other Logs for Formation Evaluation
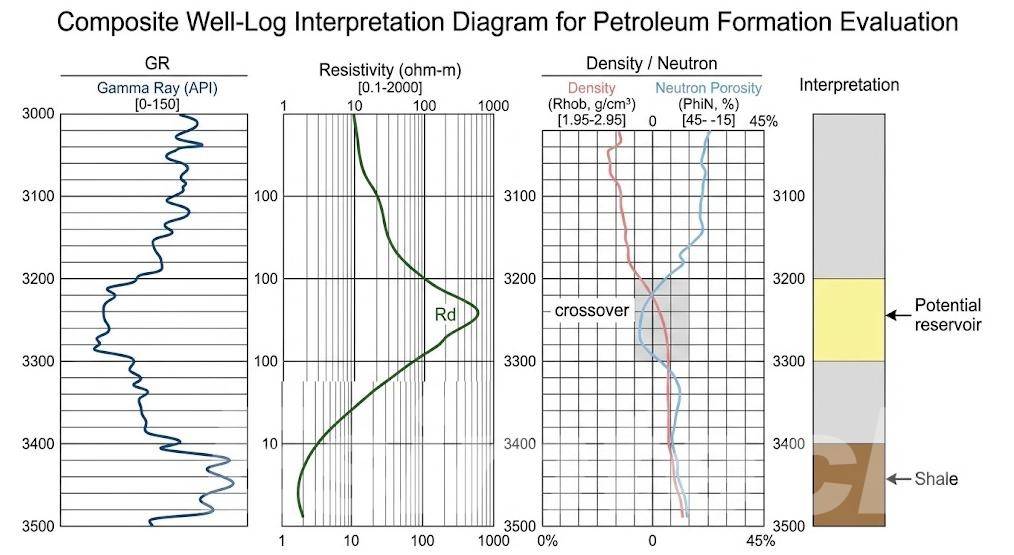
Combining gamma-ray (GR) measurements with other logging data can enhance the reliability of reservoir evaluation.
A typical analysis process is:
GR → Mudstone/Rock Type Assessment → Porosity → Resistivity → Fluid Property Interpretation
For example, a well section with low GR, reasonable porosity, and high resistivity may be a potential hydrocarbon reservoir, worthy of further attention; a well section with low GR but low resistivity may contain water.
These combined characteristics can only serve as screening indicators, not absolute criteria. Actual interpretation still requires the combination of a complete set of logging data, cores, and other stratigraphic data for verification.
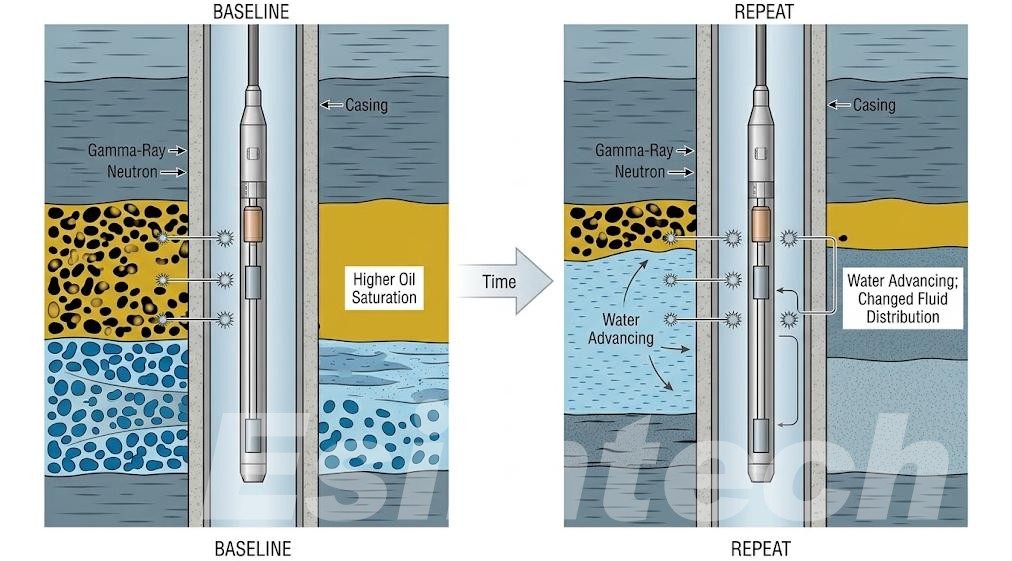
It should also be noted that not all high GR well sections are mudstones. Even if the formation is not purely mudstone, radioactive minerals may cause an increase in GR. For example, potassium minerals, feldspar rocks, sericite, and uranium-rich substances can all produce a higher GR response. When GR and other logging curves are inconsistent, spectral gamma (Spectral GR) data that can distinguish the contributions of potassium, thorium, and uranium is particularly useful.
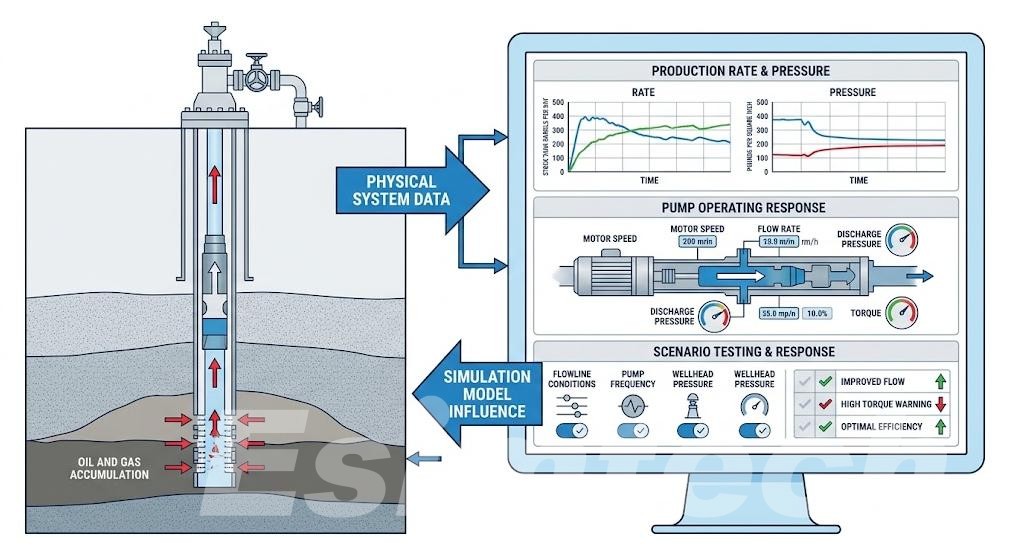
This is also where the practical value of simulation training lies. Esimtech is dedicated to developing petroleum engineering simulation systems and software solutions for oil and gas training, and through simulated training environments, helps trainees practice linking logging responses, formation characteristics, and formation evaluation decisions.
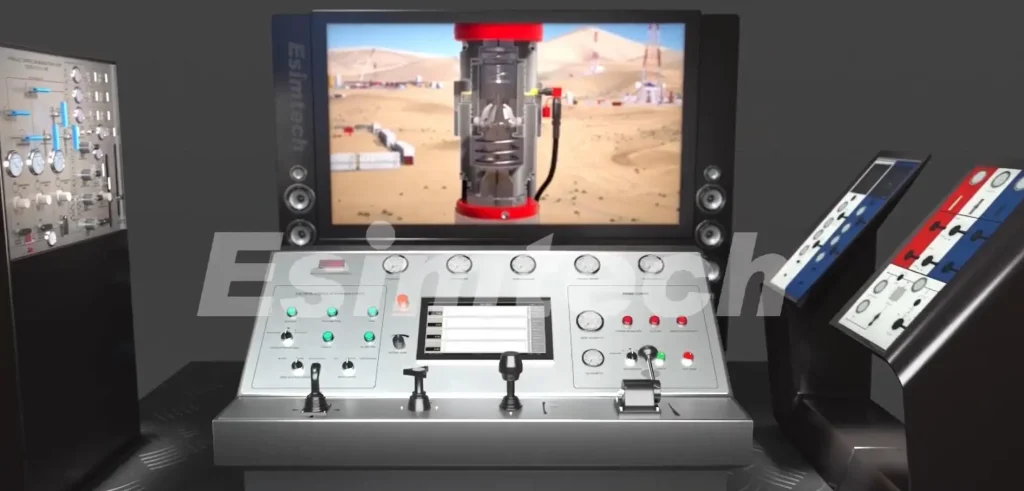
The focus of the training is not only on identifying the highs and lows of the GR curve, but also on understanding the reasons for the response and determining whether the interpretation results are supported by other data.
Read more: How to Interpret Well Logging Data
A 5-Step Workflow for Interpreting a Gamma Ray Log
When analyzing the natural gamma (GR) logging curves, the following steps can be followed:
1. Establish a local baseline.
Identify representative pure rock and shale sections, and avoid directly applying a uniform GR cutoff value.
2. Observe the curve shape.
Pay close attention to continuous changes, box-shaped features, gradual trends, and jagged patterns.
3. Estimate shale content as necessary.
Calculate the GR index and select an appropriate shale content (Vsh) model based on the geological characteristics of the formation.
4. Cross-validate reservoir interpretation.
Before determining the reservoir, compare the GR with other logging curves such as resistivity, density, and neutron to verify.
5. Analyze abnormal GR responses.
If high GR values do not match the rock characteristics, consider the influence of radioactive minerals and combine energy spectrum GR or other data for judgment.
The core principle is: Gamma logging is an effective tool for lithology screening and stratigraphic correlation, but it cannot be used alone to evaluate reservoir quality.
A reliable GR interpretation should start with the curve shape, combined with geological genesis judgment, and then verified using independent logging data. Only in this way can GR logging evolve from a single lithology indicator tool to become an integral part of complete stratigraphic evaluation.