How to Interpret Well Logging Data: From Log Curves to Engineering Decision
In oilfields or geological research institutes, this phrase often marks the beginning of a journey of underground exploration. Well logging data, hailed as "the geologist's eyes," is the most crucial bridge connecting drilling engineering and reservoir understanding.
One of the fundamental methods in the oil and gas industry is the interpretation of well logging data. This technology finds its application in oil and gas exploration and drilling engineering. A comprehensive analysis of the well logging curves including natural gamma, resistivity, density, neutron, and acoustic logging is performed and the results are interpreted by the engineers to get the information about the formation lithology, porosity, fluid types, and reservoir engineering effectiveness. This information is vital for making decisions regarding the sites for new the wells, the design of well completion, and the testing of wells.
What Is Well Logging Data and Why Is Interpretation Important?
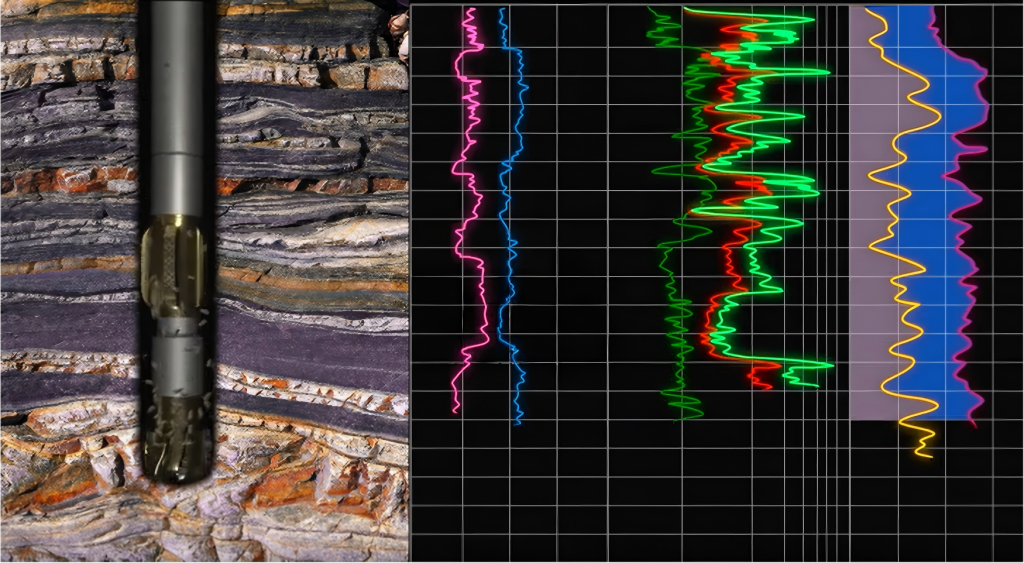
Well logging data refers to the data curves obtained by continuously measuring the physical properties of the formation using downhole logging instruments. These data do not directly reflect whether "oil and gas are present," but rather reflect the physical responses of the formation, such as radioactivity, electrical conductivity, density, and acoustic characteristics.
In practical engineering, well logging interpretation results directly affect:
- Whether a valid reservoir is identified
- Whether the target interval is suitable for completion
- Whether oil testing, fracturing and other operations are economical
Compared to core and logging data, well logging has the advantages of strong continuity, wide coverage, and high real-time performance, thus becoming an indispensable data foundation for oil and gas engineering decision-making.
Common Well Log Types and Their Geological Significance
Natural Gamma (GR) Logging – A Fundamental Tool for Lithology Identification
Natural gamma logging primarily reflects the intensity of natural radioactivity in formations and is often used to distinguish between argillaceous and non-argillaceous formations.
Generally speaking:
- High GR value: mudstone, shale
- Low GR value: sandstone, carbonate rock
It should be noted that some potassium-bearing sandstones or volcanic clastic rocks may also exhibit high GR, therefore GR usually needs to be used in conjunction with other logging curves.
Resistivity logging—a core indicator for determining hydrocarbon content
Resistivity logging is a key method for identifying oil and gas-bearing reservoirs. Its basic principle is as follows:
- Formation water has high electrical conductivity → low resistivity
- Oil and gas have low electrical conductivity → high resistivity
In practical interpretation, the impact of mud intrusion is often determined by combining deep and shallow resistivity curves:
- A significantly higher resistivity at depth compared to shallow depth usually indicates an oil or gas reservoir.
- If the resistivity at depth and shallow depth are similar, it is more likely to be a water layer.
It is important to emphasize that high resistivity does not necessarily mean an oil and gas reservoir; it may also be related to low porosity or special lithology.
Density, Neutrons and Acoustic Logging—Porosity and Gas Layer Identification
Density, neutron, and sonic logging are primarily used to evaluate the porosity characteristics of reservoirs.
- Density Logging: Emit gamma rays and measure electron density to obtain the volume density of the rock. Low density usually indicates a high porosity.
- Neutron Logging: Emit neutrons and measure the hydrogen index of the formation. Hydrogen is mainly present in the pore fluid, so the reading reflects the porosity.
- Sonic Logging: Measure the propagation speed of sound waves in the formation. A large sonic time difference means a slow propagation speed, usually indicating a high porosity or loose rock texture.
The combination and separation of these three curves are crucial for interpreting rock properties and identifying special fluids, especially natural gas.
How to Interpret Well Logging Data Step by Step: A Practical Workflow
Well logging data interpretation should follow the engineering logic of "lithology first, porosity second, fluid first, and effectiveness last".
Step 1: Determine Lithology and Effective Intervals
First, use GR curves to stratify the reservoir, distinguishing between clay layers and potential reservoirs. Then, combine density or sonic logging data to further confirm the lithology type, laying the foundation for subsequent interpretation.
Step 2: Determine Reservoir Porosity Characteristics
Calculate porosity using density, neutron, and sonic logging, and assess the impact of clay content on porosity, focusing on effective porosity rather than apparent values.
Step 3: Identify Water-Bearing, Oil-Bearing, or Gas-Bearing Reservoirs
Cross-validate using porosity and resistivity curves:
High porosity + high resistivity → High probability of oil/gas reservoir
High porosity + low resistivity → Obvious water-bearing characteristics
Gas-bearing reservoirs are usually accompanied by significant neutron-density separation.
Step 4: Comprehensive Evaluation of Reservoir Effectiveness
Finally, combine sonic anomalies, fracture development, and regional geological background to determine whether the reservoir has practical development value.
Typical Log Responses for Oil, Gas, and Water Zones
- Reservoir layer: Low GR, medium porosity, high resistivity
- Gas layer: Low density, high resistivity, significant separation between neutron and density
- Water layer: Higher porosity but lower resistivity
In practical applications, it is recommended to make a comprehensive judgment on different layer types through a comparison table to reduce misjudgment caused by a single curve.
Well Log Interpretation for Shale Gas and Unconventional Reservoirs
The focus of well logging interpretation for unconventional reservoirs has shifted from "high porosity and high permeability" to "organic matter, brittleness, and fractures."
Shale reservoirs often exhibit the following characteristics:
- High GR + High resistivity
- Low density (high organic matter content)
- Increased sonic transit time.
In shale gas development, well logging data is not only used for reservoir identification but also directly serves the selection of fracturing intervals and the design of engineering parameters.
Applications of Well Logging Data in Drilling and Engineering Decisions
In practical engineering, well logging data is not only used for reservoir evaluation but also directly participates in well location selection, completion interval optimization, and engineering scheme verification.
In order to minimize uncertainties through field interpretation, engineering teams commonly do a comparative analysis of well logging responses under different formation conditions before starting operations. As an example, the Well Logging Simulator can change logging curves under various porosity, fluid types and mud invasion conditions, which will help the engineers to perceive the relationship between the logging data and the formation characteristics more intuitively thus making the interpretation consistent and the engineering decisions reliable.
Common Pitfalls in Well Logging Data Interpretation
- Drawing conclusions solely based on a single well logging curve
- Ignoring the effects of mud invasion and the logging environment
- Equating high resistivity simply to an oil and gas layer
These misunderstandings are particularly common in complex geological formations, and they often require the joint analysis of multiple curves and well data to be avoided.
Conclusion
The interpretation of logging data is not merely a simple curve analysis; it is a comprehensive process that integrates geological understanding, engineering experience, and data analysis capabilities. Only when the mechanism of logging responses is fully understood can the logging data truly be transformed into reliable engineering decision-making basis.